
Insights · Naples and Collier County
Why Collier County tap water is hard on a new plaster finish
Collier County tap water is not what most people expect it to be, and a new plaster finish is where the difference shows up first. The county publishes the number that explains it, and almost nobody filling a pool has read it.
 Clayton Waggoner, Owner and Managing Member · Published August 18, 2026 · 19 min read
Collier County tap water averaged 67 mg/L hardness in 2024, in a range of 42 to 94 mg/L (Collier County Water-Sewer District, 2024)1. On the county's own scale that is moderately hard for drinking1, but for a freshly plastered pool it is soft. Fill water carrying less calcium than the finish wants behaves aggressively toward that finish rather than scaling it, which is why calcium has to be added deliberately at start-up.
The short version
Is Collier County tap water hard or soft?
That figure comes from the utility itself rather than from a testing service or a trade estimate. The Collier County Water-Sewer District publishes an Annual Water Quality Report each year, and the 2024 data year report, dated 23 May 2025, states the range of hardness delivered in 2024 as 42 to 94 mg/L, or 2.4 to 5.5 grains per gallon, with an average of 67 mg/L (Collier County Water-Sewer District, 2024)1. Two numbers matter there and most summaries drop one of them: the average, and how wide the range around it is.
The same report publishes the classification scale the county uses. It defines 0 to 60 mg/L as soft water, 61 to 120 mg/L as moderately hard, 121 to 180 mg/L as hard, and above 180 mg/L as very hard (Collier County Water-Sewer District, 2024)1. On that scale 67 mg/L is moderately hard, and it clears the soft threshold by seven units. So the honest answer to a homeowner asking whether the water is hard is: for drinking and for your dishwasher, mildly. That is a real answer, and it is also the answer that misleads people about their pool.
One utility could be a quirk of one treatment train. It is not. The City of Naples Utilities Division draws its source water from the Lower Tamiami Aquifer through 51 wells and treats it with lime softening at its own plant, and its Consumer Confidence Report for the same data year puts the delivered range at 58 to 102 mg/L with an average of 67 mg/L, or 3.91 grains per gallon on average (City of Naples Utilities Division, 2024)2. Different aquifer, different plant, different utility, same average.
The Collier County plants get there another way again. The North Plant runs nanofiltration and reverse osmosis, and the South Plant runs lime softening and reverse osmosis, drawing from wellfields in the Hawthorn and Golden Gate Tamiami systems (Collier County Water-Sewer District, 2024)1. Three different treatment processes across two utilities converge on roughly the same delivered hardness. When two independent public records land on the same figure by different routes, it stops being a data point and starts being a design constraint.
Convert it once and keep the conversion. Roughly 67 mg/L is roughly 3.9 grains per gallon, which is the unit most test kits and most water softener salespeople speak in. If someone tells you Naples water is hard and needs treating, they are talking about a scale calibrated for soap and kettles, not for a cement vessel holding twenty thousand gallons.
| Utility | Average hardness | Reported range | Treatment |
|---|---|---|---|
| Collier County Water-Sewer District1 | 67 mg/L (2.4 to 5.5 gr/gal across the range) | 42 to 94 mg/L | Nanofiltration and reverse osmosis at the North Plant; lime softening and reverse osmosis at the South Plant |
| City of Naples Utilities Division2 | 67 mg/L (3.91 gr/gal) | 58 to 102 mg/L | Lime softening and filtration, source water from the Lower Tamiami Aquifer via 51 wells |
What does soft fill water actually do to a new plaster finish?
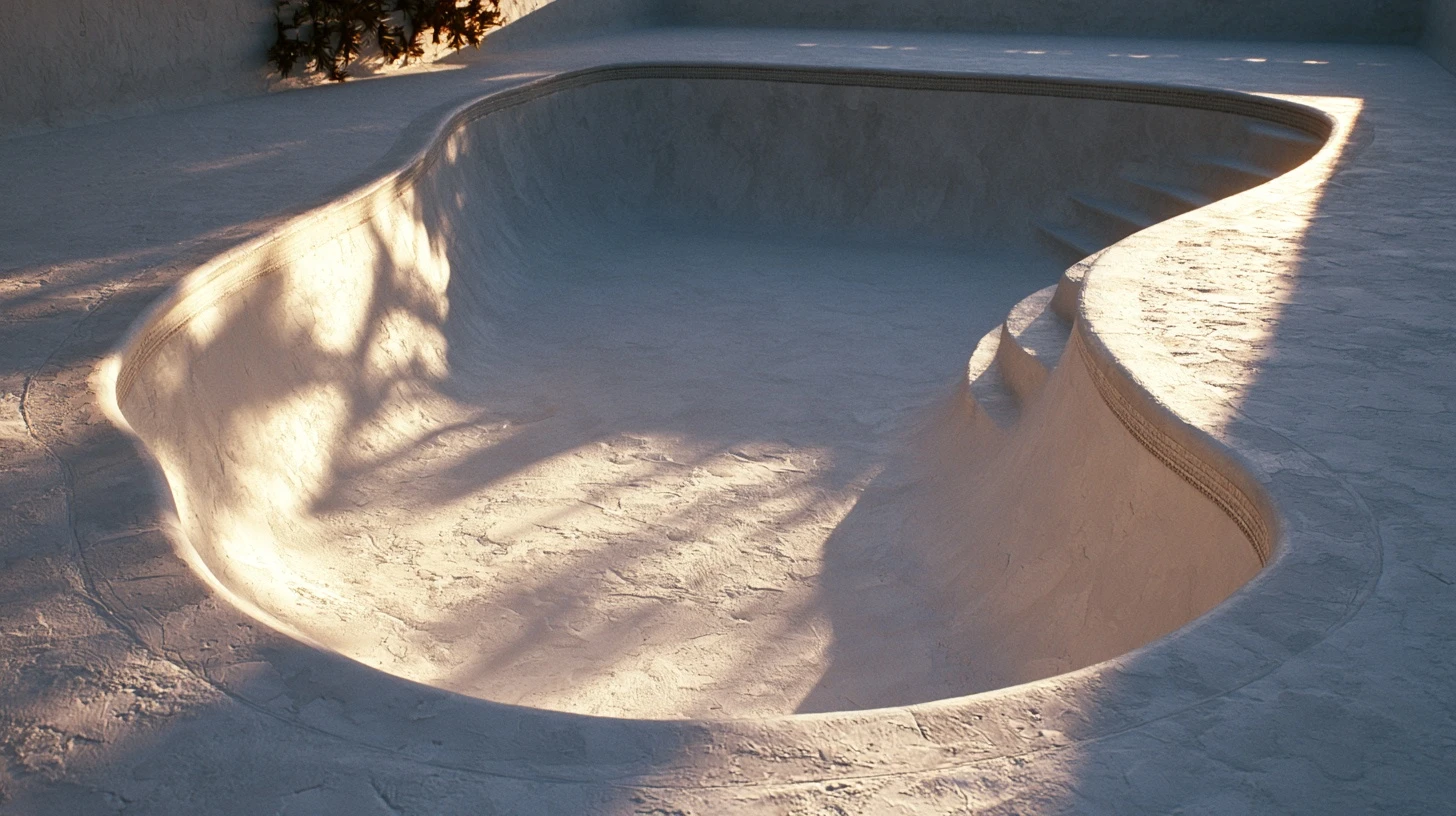
Start with what the finish is made of. Pool plaster, and the cement matrix that holds a pebble or quartz aggregate in place, is a cement based material. As it cures it forms calcium compounds, and the surface of a new finish is chemically young and comparatively open. It has not yet reached the settled, tight state a finish arrives at after its first season.
Now put water on it. Water is a solvent, and its appetite for calcium carbonate is not infinite: it will take calcium into solution until it approaches saturation, then stop. Water that already carries a lot of calcium has little appetite left, and under the right conditions it will deposit some back out as scale. Water that carries little calcium has appetite to spare. It does not care where the calcium comes from, and in a freshly filled pool the largest and softest source available is the surface it is sitting against.
That is the whole mechanism, and it explains why the direction of the local problem is the opposite of the direction the generic advice assumes. A pool filled with water that is already calcium rich has a scaling risk to manage. A pool filled at 67 mg/L has the reverse: water with capacity, in contact with a young cement surface, for weeks. The published hardness figure is doing the work in that sentence, not an opinion about it.
There is a second thing worth understanding about the number itself. A utility reports total hardness, which counts calcium and magnesium together. A pool is managed on calcium hardness alone. The calcium portion of a 67 mg/L total is necessarily lower than 67, which means the gap between what the fill water carries and what a start-up plan targets is wider than the headline figure suggests, not narrower.
The word soft is doing real work here, so it is worth pinning down. The University of Florida IFAS Extension publishes a hardness classification in its water quality literature that runs soft at 0 to 17 ppm, relatively soft at 17 to 50, moderately hard at 50 to 120, hard at 120 to 170 and very hard above 170 (University of Florida IFAS Extension, 2024)3. Both that scale and the county scale are calibrated for household water, and both put 67 mg/L in the middle. Neither of them was ever written with a plaster shell in mind, which is exactly why reading the local situation off a drinking water scale sends people the wrong way.
None of this makes Collier water bad water. It is well treated and it is well documented. It means the fill is a chemistry event with a known direction, and that the start-up plan has to add calcium deliberately rather than assume the hose brought enough. If you are still choosing the finish itself, choosing between pebble, plaster and quartz is the decision upstream of this one, and the fill water argument applies to every cement bound option among them.
Is there chlorine or chloramine in Collier County tap water?
This is the second thing arriving through your hose, and it matters because a pool and a water main are trying to do two different jobs. A distribution system wants a disinfectant residual that survives for miles and for days. Chloramine, which is chlorine already combined with ammonia, is chosen for exactly that reason: it is stable and it persists. A pool wants free chlorine, which is reactive and available. Those are not the same substance behaving in two settings. They are two different chemistries.
The county reports the residual it delivers. Its 2024 Annual Water Quality Report lists chloramines monitored monthly through 2024 at an average of 3.4 ppm across a range of 1.6 to 4.1, against a maximum residual disinfectant level of 4 (Collier County Water-Sewer District, 2024)1. So a hose filling a pool is delivering roughly 3 ppm of combined chlorine, continuously, for the whole fill. On a test kit that reads total chlorine, that shows up as a number. It is not sanitizer capacity, and treating it as though it were is how a fresh fill gets under-chlorinated in its first week.
The same sentence in the report carries a second fact worth reading properly. The county adds a corrosion inhibitor to prevent corrosion of pipes (Collier County Water-Sewer District, 2024)1. That inhibitor is dosed to protect a distribution system made of metal. It was not designed around, and says nothing about, a cement based pool interior. It is a good example of how a utility can be doing its own job well while the water it delivers still needs handling at your end.
There is a discrepancy in the public record here, and it is worth naming rather than smoothing over, because it is the reason so many people believe Naples runs on chlorine. The City of Naples Consumer Confidence Report describes its water in narrative as chlorinated for disinfection purposes, but the same report's own Stage 2 disinfection byproduct table reports chloramines at an average of 2.97 ppm across a 0.40 to 4.70 range (City of Naples Utilities Division, 2024)2. The table is the monitored data and the narrative is a summary sentence. The table governs.
Which means the practical read is the same on both systems. Municipal fill water in this area arrives with a combined chlorine residual, not a free chlorine one, and a start-up that assumes otherwise is starting from a number it has misread.
Why does the county change the disinfectant in your tap water in late summer?
This is the part of local water chemistry that almost nothing written for Southwest Florida pool owners mentions, and it is published in plain sight on a county page. For roughly a month in late summer the disinfectant in the fill water is not the disinfectant that was in it the month before. The county describes the change as a routine practice recommended by the Florida Department of Environmental Protection, which is the language of a recurring annual step rather than an incident (Collier County Public Utilities, retrieved 2026)4.
Something else runs at the same time. The county also states that Collier County Water will flush water mains and fire hydrants from August 2 to September 18, with crews working seven days a week, 24 hours a day, throughout the service area (Collier County Public Utilities, retrieved 2026)4. So the disinfectant window and the flushing program overlap for most of their length. Two things are moving in the distribution system at once, and a fill scheduled inside that overlap is drawing from a system in an unusual state on both counts.
The county tells customers what to expect. Its page warns that customers may notice temporary changes in taste, odor or color of tap water, and cloudy or discolored water during flushing near their location (Collier County Public Utilities, retrieved 2026)4. Cloudy water going into a pool that is being watched closely for the clarity of a new finish is a false alarm nobody needs, and knowing the flushing schedule turns an alarming week into an expected one.
The line that tells you the county considers this a genuine chemistry event rather than a cosmetic one is aimed at a different audience entirely. The same page advises fish and aquatic pet owners to contact a local fish store for water pretreatment guidance (Collier County Public Utilities, retrieved 2026)4. A utility does not warn aquarium keepers about a change it regards as trivial. If it is enough to matter to a tank, it is enough to be worth knowing about before you put a hose in a pool.
⛔ Here is the one thing this article will not do, and the reason. The county's page prints the dates but does not print a calendar year against them. We publish the window exactly as the county publishes it, late July to late August, and we do not tell you which year's window that is, because we have not confirmed it and inventing it would be worse than leaving it open. Check the county's own drinking water page for the current dates before you schedule a fill or a start-up. It takes a minute and it is the only source that is authoritative on it.
Is fill water in Golden Gate Estates different from Naples city water?
The county does not treat well supply as a footnote. It is one of the options on the permit application question that asks who supplies water to the property, alongside the named utilities (Collier County Growth Management, retrieved 2026)5. That is a formal distinction on a government form, which is a better starting point than an assumption about where a neighborhood sits.
The measured contrast is large. Collier County groundwater monitoring wells reporting to the federal Water Quality Portal returned a median hardness of 290 mg/L as calcium carbonate across 240 samples between 2015 and 2025, with a lower quartile of 208 mg/L and an upper quartile of 378 mg/L (USGS and EPA Water Quality Portal, 2025)6. Set that beside the 67 mg/L municipal average and the two supplies are not variations on a theme. They are different starting conditions for the same job.
It also flips the direction of the problem. A finish filled at 67 mg/L is sitting in water with calcium appetite. A finish filled from groundwater at a median of 290 mg/L is sitting in water carrying far more calcium than the municipal supply, which is the scaling direction the generic advice was written for in the first place. The same national article is wrong for one of these owners and roughly right for the other, and neither of them can tell which they are without knowing where their water comes from.
Now the honest handling of that dataset, because it is easy to overstate. These are ambient groundwater monitoring wells operated by Collier County Pollution Control, the United States Geological Survey Florida Water Science Center, the Florida Department of Environmental Protection and the South Florida Water Management District (USGS and EPA Water Quality Portal, 2025)6. They are not a survey of homeowner drinking wells. No depth filter was applied and no Golden Gate Estates sub-filter was applied. What they establish is the character of the groundwater under this county, not the number that will come out of any particular well.
Which is why the instruction is the same regardless of which supply you are on, and why it is a test rather than a lookup. If you are on a well east of the county service area, the reading you need is from your own well, on the line that will fill the pool. If you are remodeling out there, pool remodeling in Golden Gate Estates starts from a different water assumption than the same job would three miles west. The measured numbers behind that assumption, and how far they sit from the county figures above, are set out in what well water does to a pool finish in Golden Gate Estates.
| Fill source | Hardness | Sample basis | Direction of the start-up problem |
|---|---|---|---|
| Collier County Water-Sewer District tap1 | 67 mg/L average, 42 to 94 mg/L range | Utility monitoring, 2024 data year | Low calcium relative to a cement finish. Calcium added deliberately at start-up. |
| City of Naples tap2 | 67 mg/L average, 58 to 102 mg/L range | Utility monitoring, 2024 data year | Same direction as the county supply. |
| Collier County groundwater monitoring wells6 | 290 mg/L median, 208 to 378 mg/L interquartile | 240 samples, 2015 to 2025, ambient monitoring wells | The opposite direction, and the one generic national advice assumes. |
What should you have tested before the fill water goes in?
This is where the article has to be honest about its own limits. The hardness figures above are real, published and checkable, and they are also the end of the public record. A Consumer Confidence Report is required to publish certain regulated contaminants, and calcium, alkalinity, pH and total dissolved solids are not among the values these reports carry (Collier County Water-Sewer District, 2024)1 (City of Naples Utilities Division, 2024)2. Anyone quoting you a local alkalinity or calcium number off a county document is quoting something the document does not contain.
So the useful version of this article is not a set of numbers to copy. It is four things to have in hand before the fill starts, three of which cost nothing.
First, test the water at the hose bib you are actually going to fill from, and test for calcium hardness specifically rather than total hardness. It is the same test any pool store runs, and doing it before the fill rather than after means the start-up plan begins with a measured number instead of an assumed one.
Second, know which supply you are on. The county already asks the question on its permit application, with the utilities and Well as the options (Collier County Growth Management, retrieved 2026)5, so the answer is usually already written down somewhere on the job.
Third, check the county's drinking water page for the current disinfectant window before you commit to a fill date4. If the fill lands inside the free chlorine window or the main flushing program, schedule the first weeks of chemistry checks around it rather than assuming the readings will behave the way they did last month.
Fourth, have the calcium number written into the start-up plan rather than discussed. A plan that names the reading it started from is a plan somebody can check later. A plan that does not is a conversation.
A finish is only as good as the first month of water that sits on it, and the start-up plan is part of the job rather than an afterthought. That is the case whether the work is pool resurfacing in Naples or a waterline tile replacement in Naples where fresh grout meets fill water at exactly the line everyone looks at. If you want the rest of the local picture, the rest of the Collier County pool guides works through the permitting, the storm season and the water questions the same way this one does.
Ask Clayton
Questions this article usually prompts
Tap a question. Clayton replies himself, here and on the phone.
Clayton Waggoner Owner and Managing Member · Splash Pools Online Tap a question to ask
If this is the situation you are in
Pool resurfacing in Naples, including the part everyone skips →Waterline tile replacement, starting behind the tile →Pool remodeling in Naples, handled as one project →Pool repair in Naples, diagnosed before it is quoted →References
- Collier County Water-Sewer District, Annual Water Quality Report, 2024 data year, report dated 23 May 2025
- City of Naples Utilities Division, Consumer Confidence Report, 2024 data year
- University of Florida IFAS Extension, EDIS SS440 (Mylavarapu), water hardness classification
- Collier County Public Utilities, Drinking Water, retrieved 13 August 2026
- Collier County Growth Management Community Development, permit application requirements (PRAC), water utility provider question, retrieved 13 August 2026
- United States Geological Survey and United States Environmental Protection Agency, Water Quality Portal, Collier County groundwater monitoring well results 2015 to 2025, reported by Collier County Pollution Control, the USGS Florida Water Science Center, FDEP and SFWMD

The article is general.
Your pool is specific.
Tell us what the pool is doing, a sentence or two is enough. The person who wrote this is the person who calls back.